Micron-scale Light Transport Decomposition Using Interferometry
Ioannis Gkioulekas Anat Levin Frédo Durand Todd Zickler
Abstract: We present a computational imaging system, inspired by the optical coherence tomography (OCT) framework, that uses interferometry to produce decompositions of light transport in small scenes or volumes. The system decomposes transport according to various attributes of the paths that photons travel through the scene, including where on the source the paths originate, their pathlengths from source to camera through the scene, their wavelength, and their polarization. Since it uses interference, the system can achieve high pathlength resolutions, with the ability to distinguish paths whose lengths differ by as little as ten microns. We describe how to construct and optimize an optical assembly for this technique, and we build a prototype to measure and visualize three-dimensional shape, direct and indirect reflection components, and properties of scattering, refractive/dispersive, and birefringent materials.
Publication
Ioannis Gkioulekas, Anat Levin, Frédo Durand, and Todd Zickler, "Micron-scale Light Transport Decomposition Using Interferometry", ACM Transactions on Graphics (TOG), 2015.
[pdf] [extended version] [fastforward] [slides]
Building your own interferometer
Detailed instructions for replicating our optical setup are included in Appendix C of the extended version of the paper. Some of the videos shown below were captured using supercontinuum laser sources that are not described in the paper. For those results, besides replacing the light source, no other change was made to the setup.
Note that our setup is designed for imaging at a field of view of two inches, and for maximizing SNR when scanning deeply inside scattering volumes. The setup can be simplified and compacted considerably for applications where the field of view is smaller than one inch, or where only depth information is needed. Here is an example.
Transient videos and data
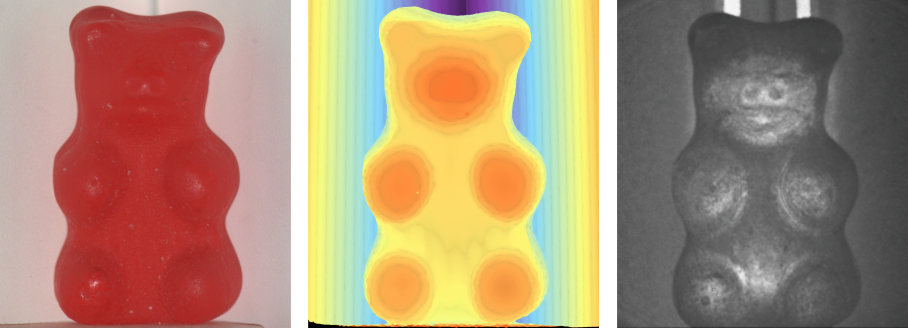
Most of the scenes below are described in the paper or in the SIGGRAPH 2015 slides. For each scene, we show tonemapped versions of a steady-state photo and the transient video of the scene, and also provide a MATLAB .mat file containing the corresponding "raw" (radiometrically linear) image and video frames. The video frames were produced by processing the originally captured sequence as described in Section 5 (in particular, Equation (36)) of the paper, and then subsampling the sequence to correspond to a pathlength resolution of roughly 50 microns. Due to their size, we do not provide the unprocessed captured sequences here, but they are available upon request.
You can download a .zip file containing the data files for all of the scenes shown below here.
Grayscale scenes captured using a superluminescent diode
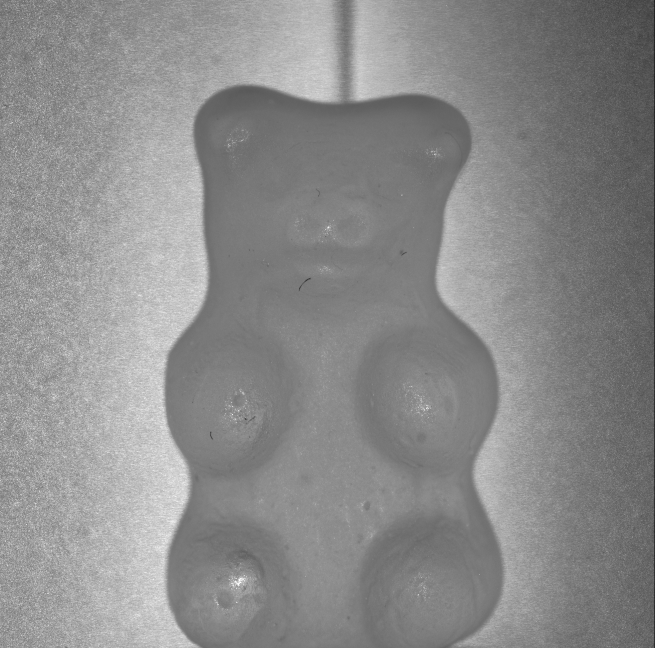
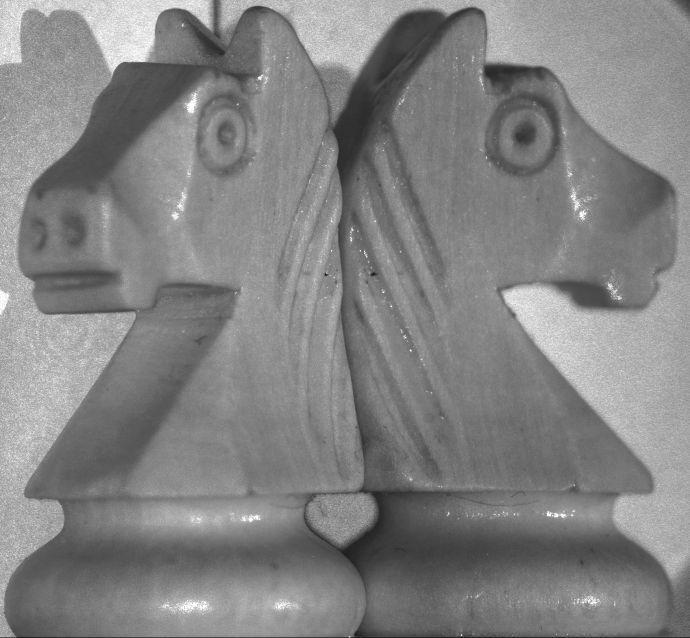
These results were captured using the superluminescent diode light source described in the paper.
Gummy bear [data] [uncompressed video]
Chess knight [data] [uncompressed video]
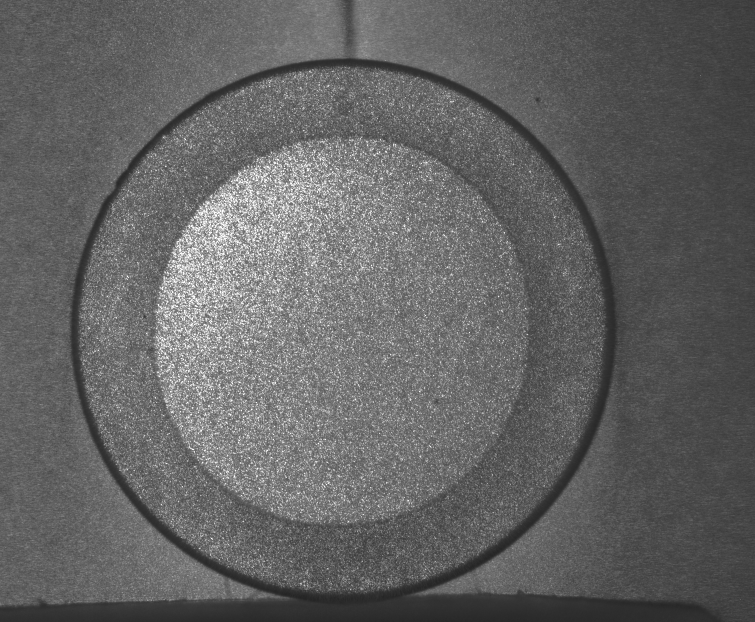
Zirconia sample [data] [uncompressed video]
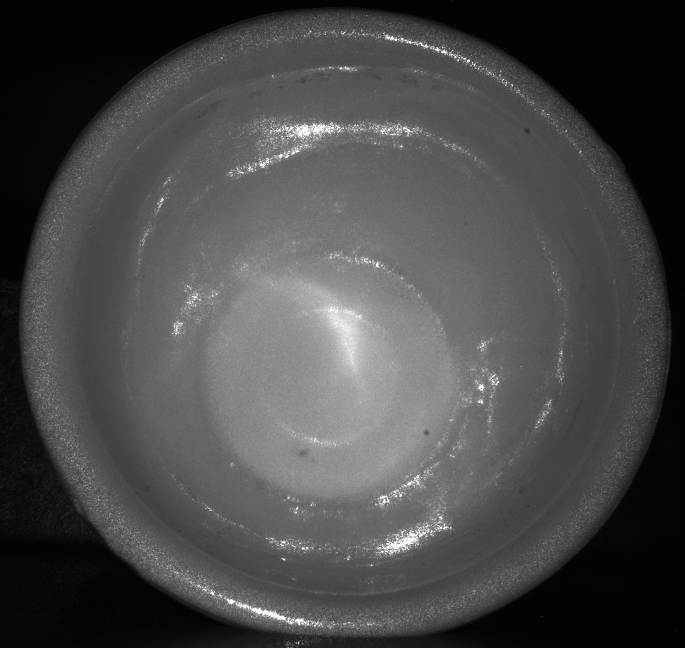
Toy cup [data] [uncompressed video]
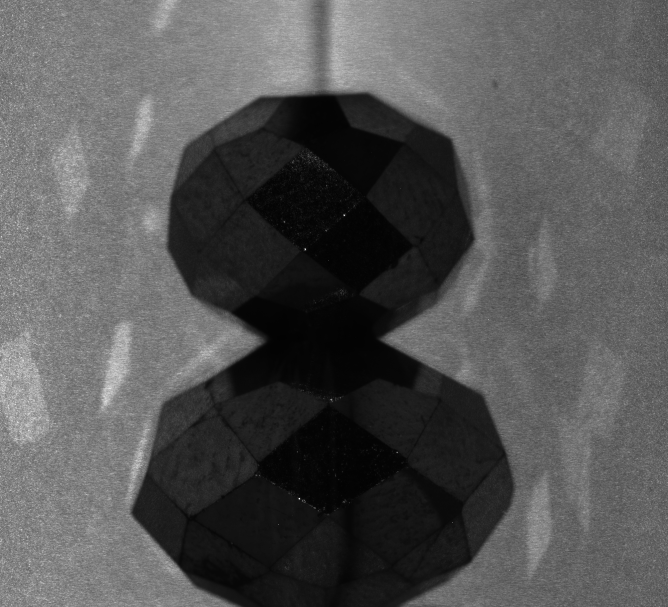
Beads [data] [uncompressed video]
Color scenes captured using a supercontinuum laser
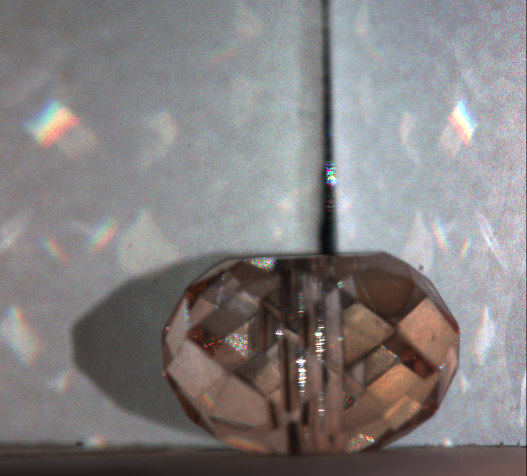
The scene below was captured using a SuperK Extreme supercontinuum laser.
Bead (color) [data] [uncompressed video]
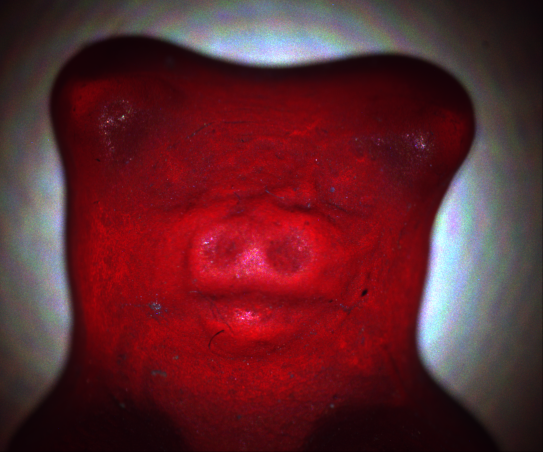
The following two scenes were captured using a SuperK Compact supercontinuum laser. Note that, due to the laser unit used, these scenes have a much more limited and unevenly illuminated field of view compared to the scenes shown previously. Additionally, the blue channel measurements are very noisy due to the low output of the laser unit near the blue end of the visible spectrum.
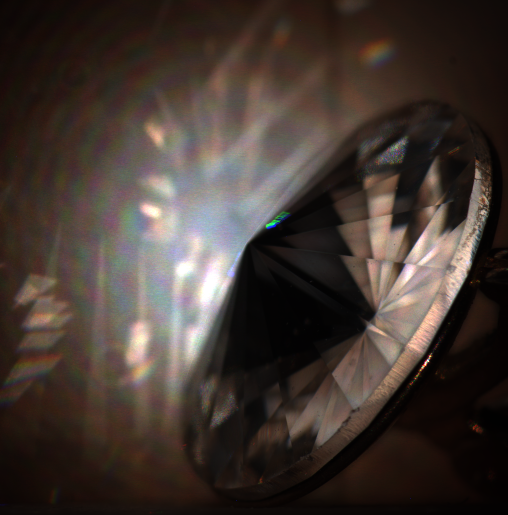
Gemstone (color) [data] [uncompressed video]
Gummy bear (color) [data] [uncompressed video]