Results & Data
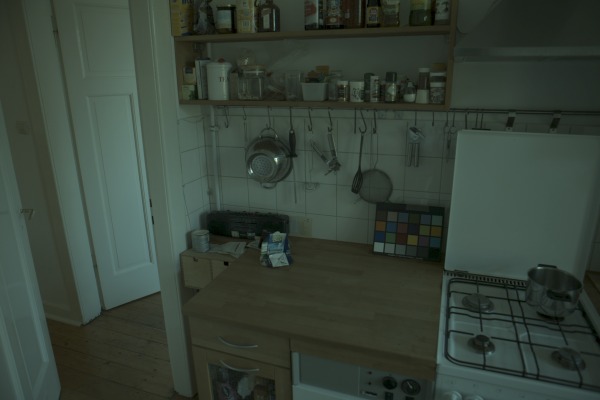
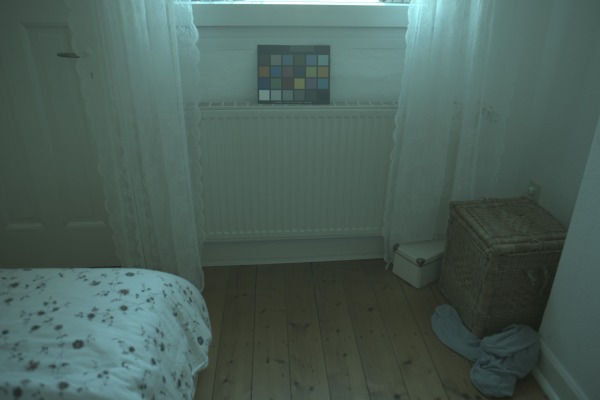
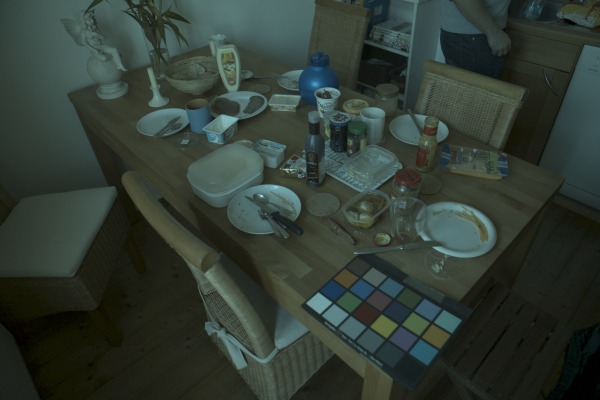
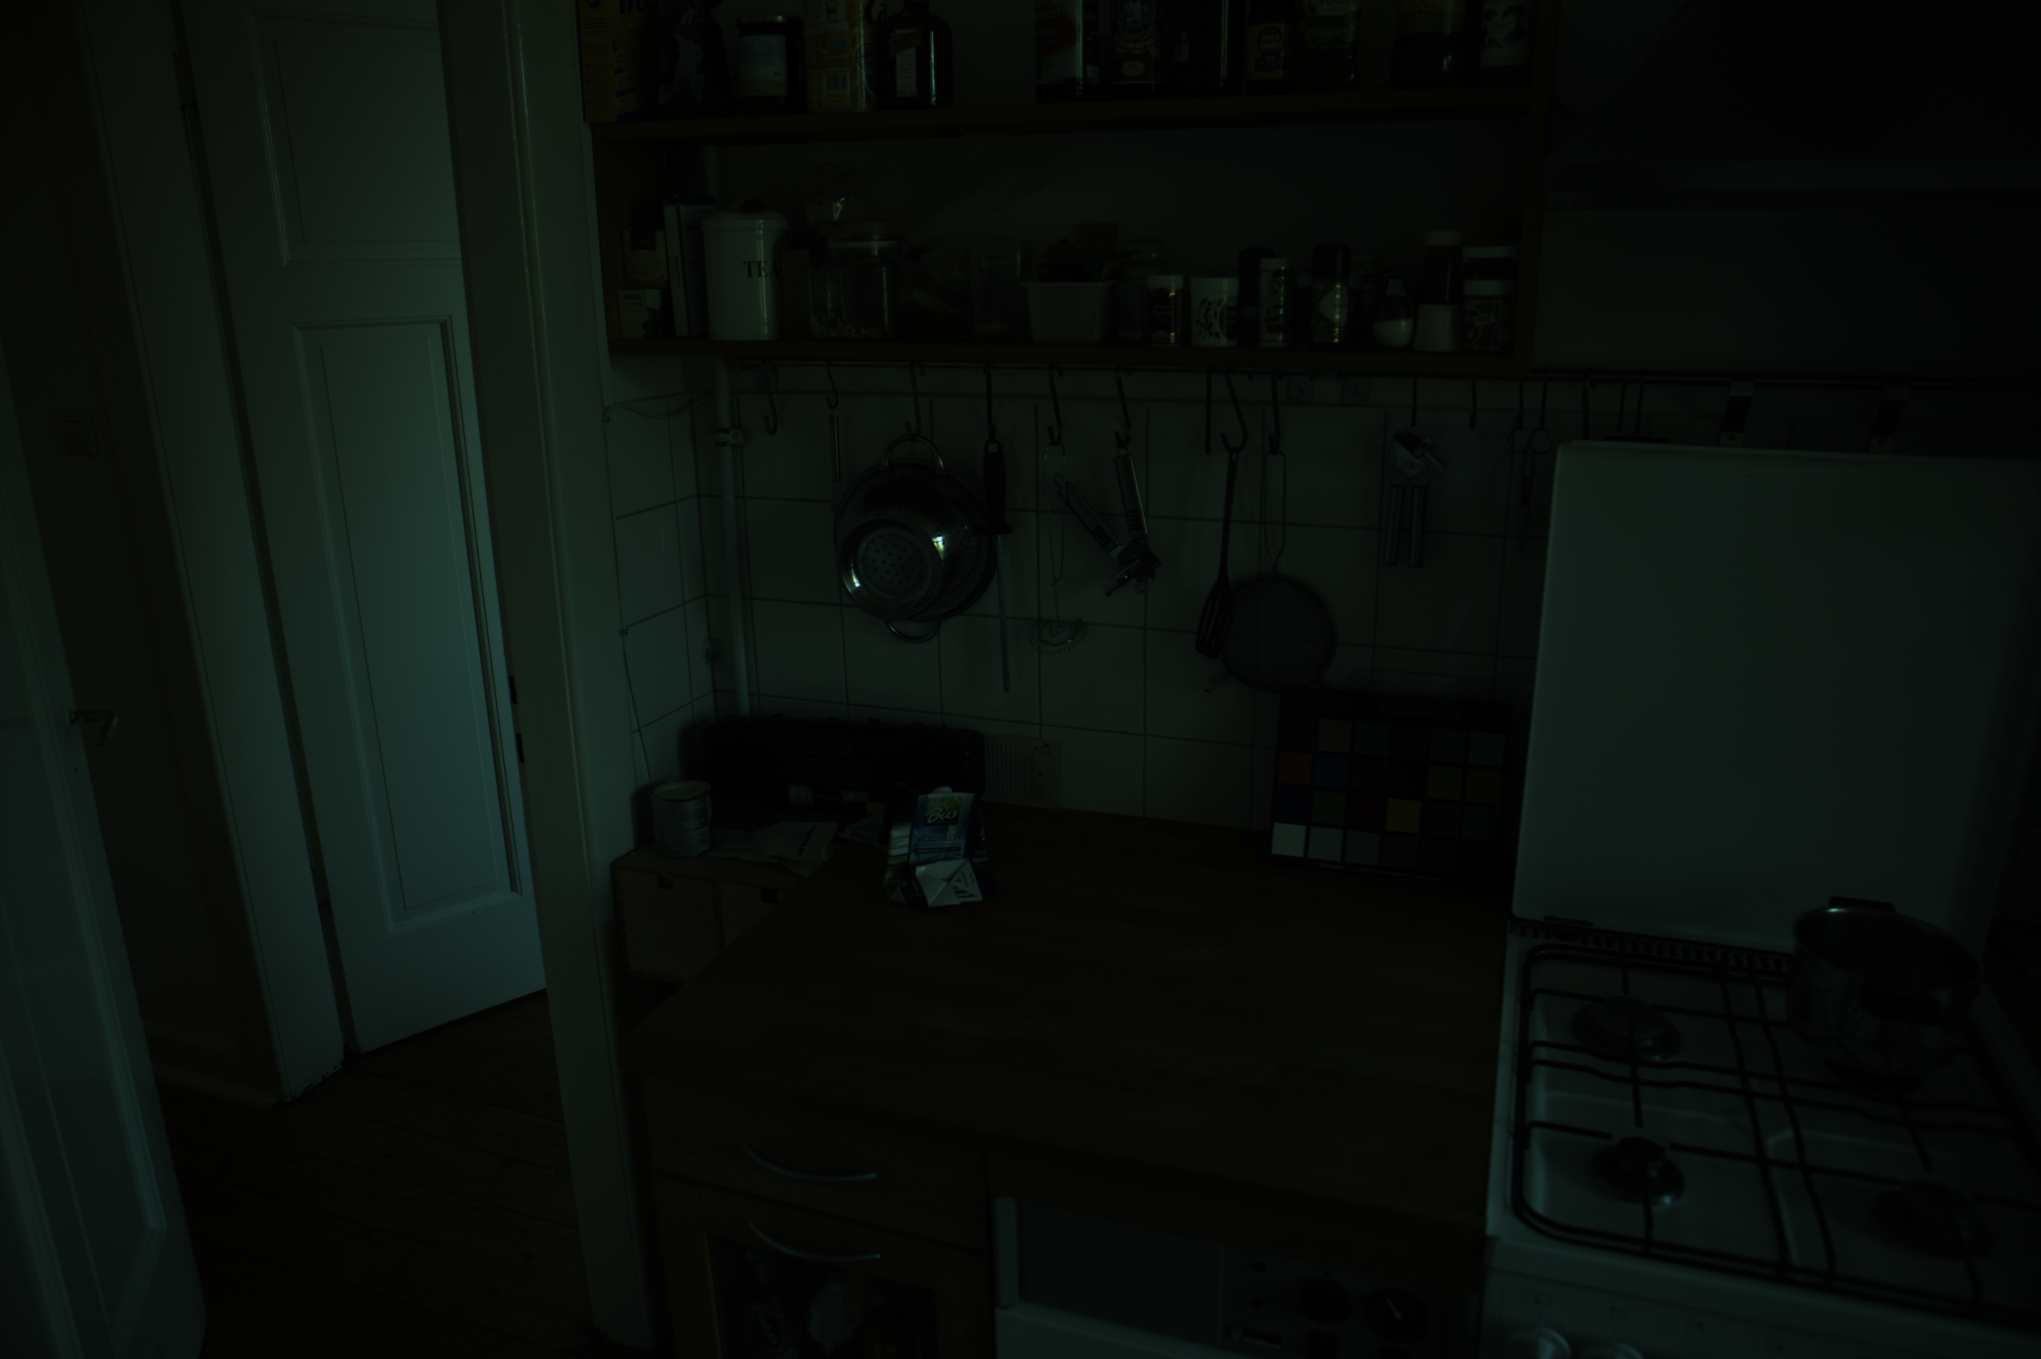
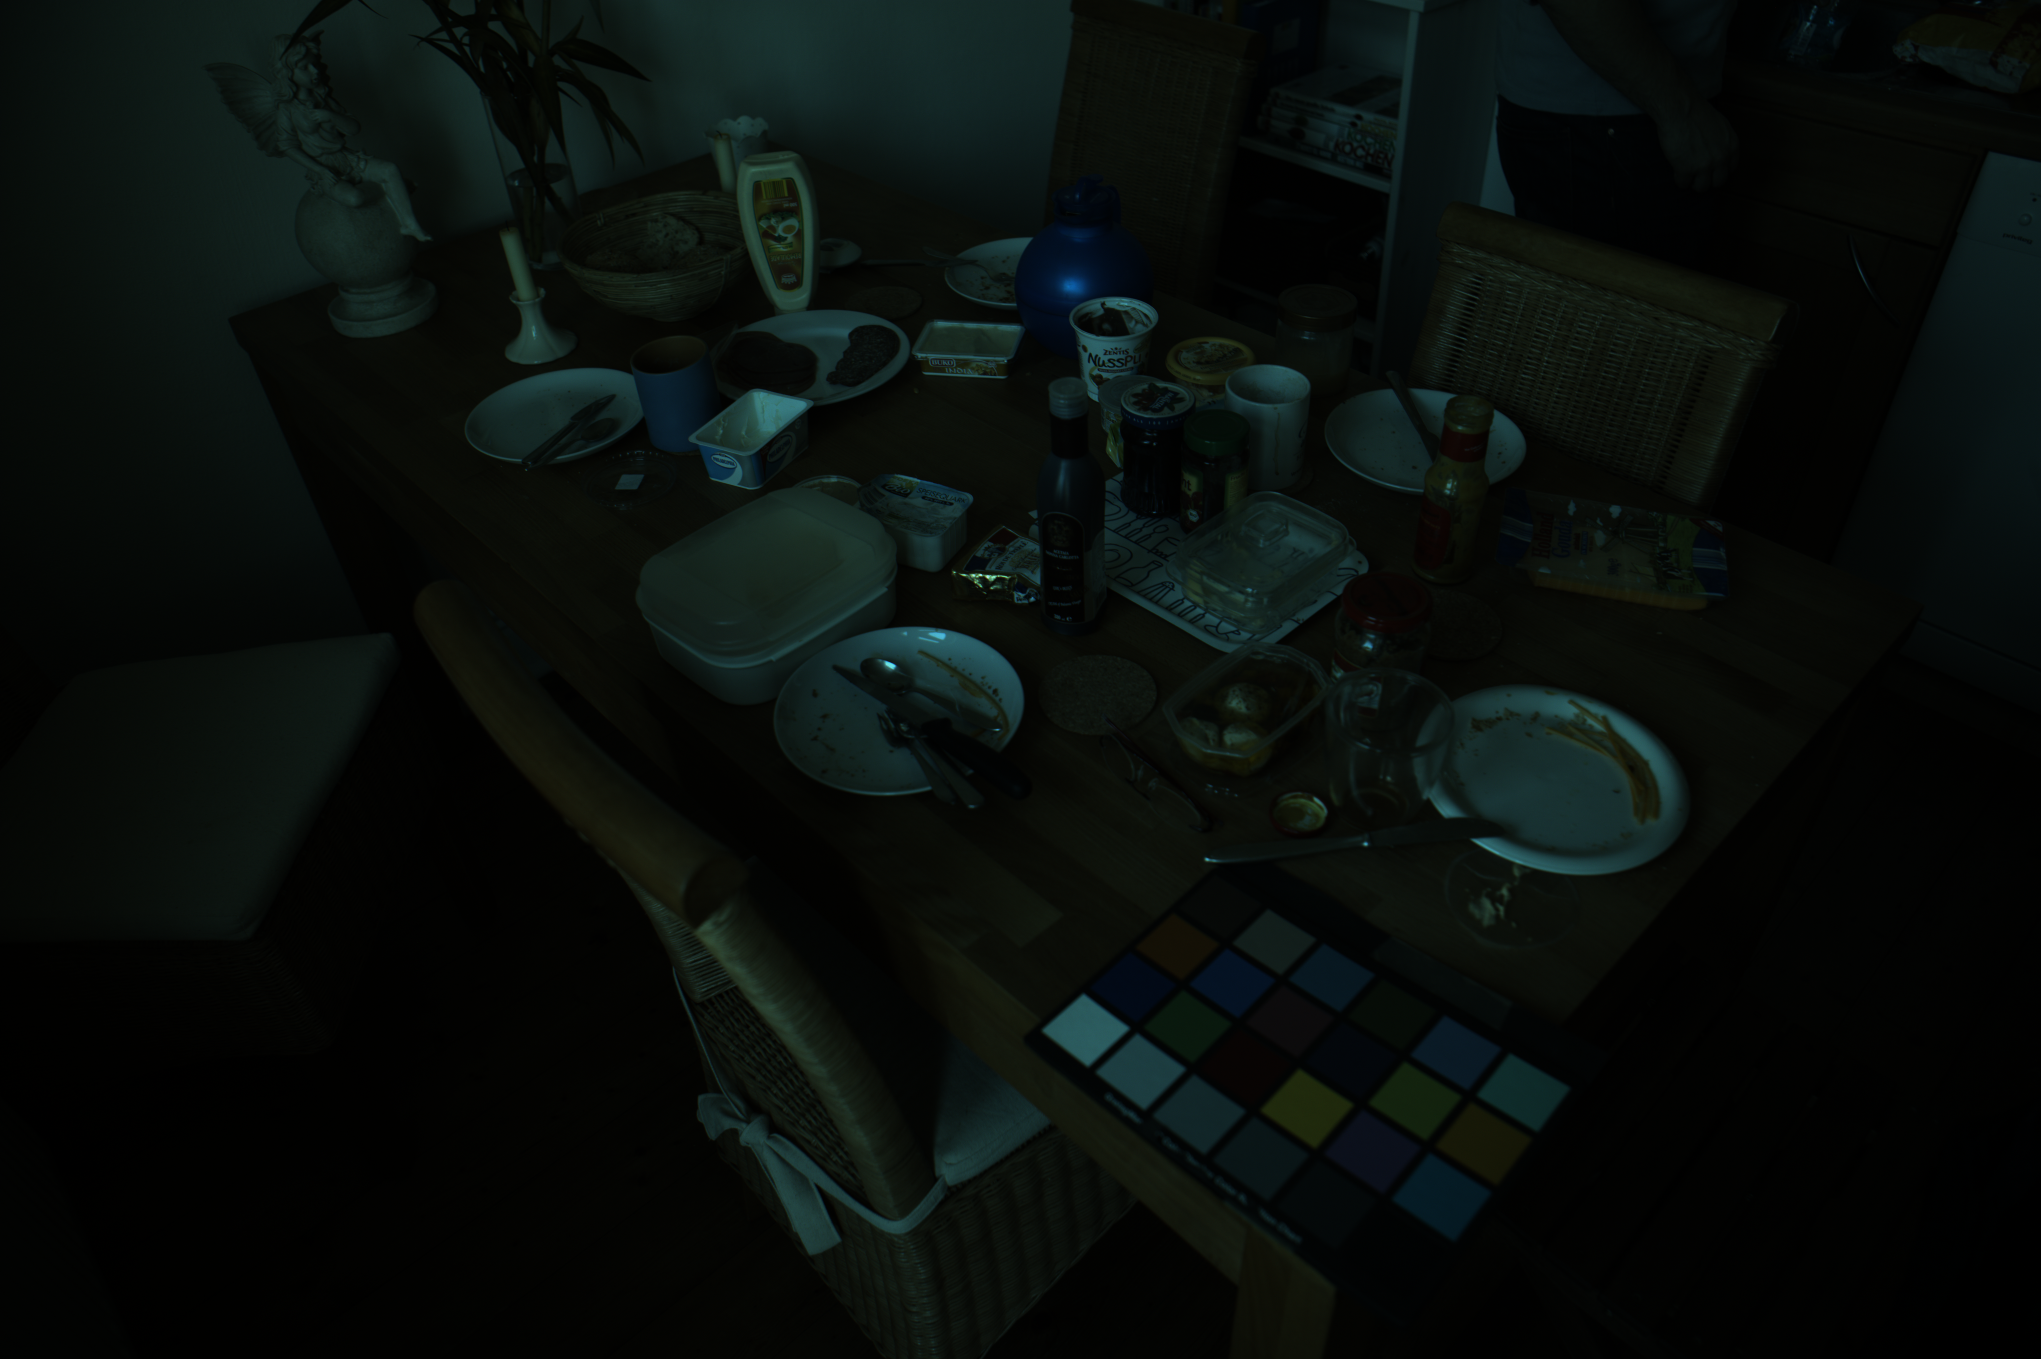
Test Images for Synthetic Experiments
 |
 |
 |
| Download Linear PNG | Download Linear PNG | Download Linear PNG |
Depth Estimation
While the paper contains an evaluation of depth estimation performance of our design in comparison to other coded-aperture strategies, this section provides details on the effect of different parameter choices on the accuracy of our approach. Moreover, we also include error maps for the test images that indicate which local regions in each image have higher error (the map shows the absolute mean error across all synthetically defocused versions). These error maps can be used to draw intuition about what kinds of image content will prove challenging to our depth estimation algorithm.
   Error in pixels |
Parameter ChoicesDefault Mean Error: 3.0 Window Size (Default = 15) N = 7 Mean Error: 4.1 N = 21 Mean Error: 2.6 Larger window sizes always increase accuracy, but lead to poorer localization. Number of Orientations (Default = 4) Only Horiz. and Vert. Mean Error: 3.3 Derivative Scale (Default = 1) s = 0.5 Mean Error: 4.2 s = 2 Mean Error: 3.1 |
Deconvolution
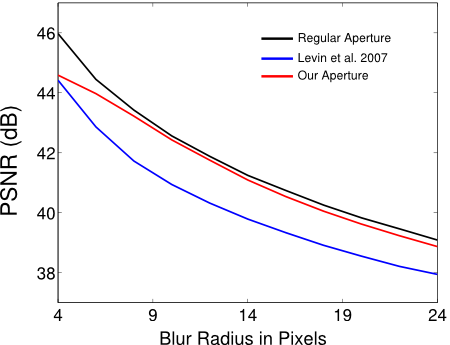
We run the synthetic deconvolution experiment (similar to that described Fig. 5 in the paper), but on all test images and for a range of depths. Shown below are the mean reconstruction PSNRs for the different aperture codes.
Results from Prototype Lens
Below are the high quality input images and computed depth maps and deblurred images, for the results reported in the paper.
ZIP